
The elegance of ggplot functions realizes in simple yet compact expression of visualization formula while hiding many options assumed by default. Hiding doesn't mean lacking as most options are just a step away. For example, for color color selection use one of the methods from the scale family of functions such as scale_fill_brewer():

And argument palette controls choice of colors in scale_fill_brewer():

Palettes used live in the package RColorBrewer - to see all available choices simply run display.brewer.all():


There are 3 types of palettes - sequential, diverging, and qualitative - each palette containing from 8 to 12 colors (see data frame brewer.pal.info or help ?RColorBrewer for more detail).
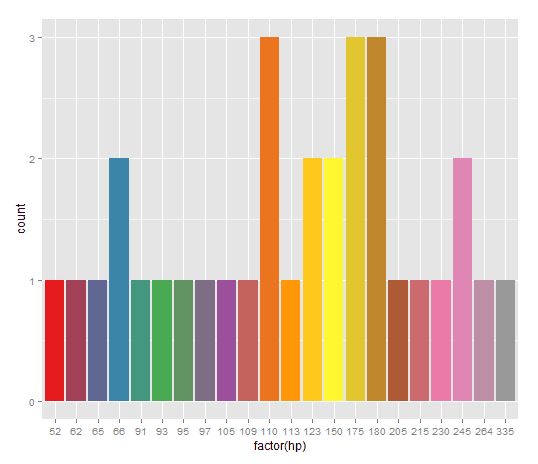
Curious reader may notice that if a bar chart contains 13 or more bars we get in trouble with colors like in the next plot:

Indeed length(unique(mtcars$hp)) finds 22 unique values for the attribute horse power, while the palette Set2 has 8 colors to choose from. Lack of colors in the palette triggers ggplot to issue warning like this (and invalidates plot as seen above):
1: In brewer.pal(n, pal) :RColorBrewer gives us a way to produce larger palettes by interpolating existing ones with constructor function colorRampPalette(). It generates a function that does actual job of build palettes with arbitrary number of colors by interpolating existing palette. Thus expanding the palette Set1 of 9 colors to 22 (the number of unique horse power values in mtcars):
n too large, allowed maximum for palette Set2 is 8
Returning the palette you asked for with that many colors
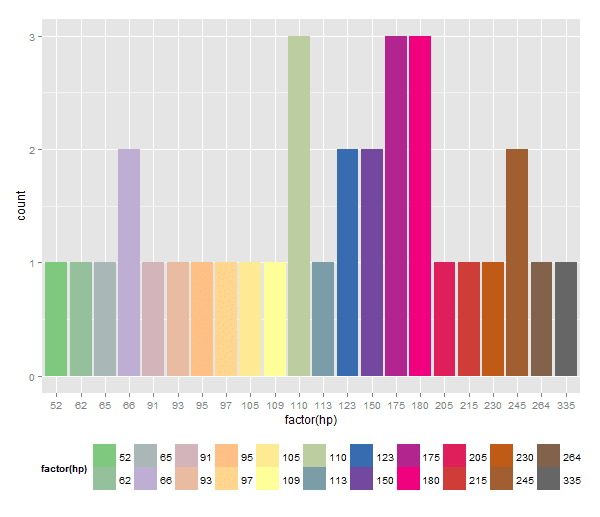
While we addressed color palette deficiency other interesting things happened: even though all bars are back and are distinctly colored we lost the color legend. I intentionally added theme(legend.position=...) to showcase this fact: despite explicit position request in theme() the legend is no more part of the plot.
The difference: fill parameter was moved outside of histogram aes() function which effectively removed color information from ggplot() aesthetics mapping. Hence, there is nothing to apply legend to.
To fix move fill back into aes() and use scale_fill_manual() to define custom palette:

Another likely problem with large number of bars in plots like above is placing and layout of the legend. Adjust legend position and layout using theme() and guide_legend() functions as follows:

Finally, the same example using in place palette constructor with different choice of library palette:
There are quite a few more scale functions to choose from depending on aesthetics type (colour, fill), color types (gradient, hue, etc.), data values (discrete or continuous).
UPDATE (09.16.17)
Not to undermine usefulness of RColorBrewer but there are more choices available in R. One example is package ggthemes that besides offering complete themes and scales for ggplot2 contains themed color palettes:

